

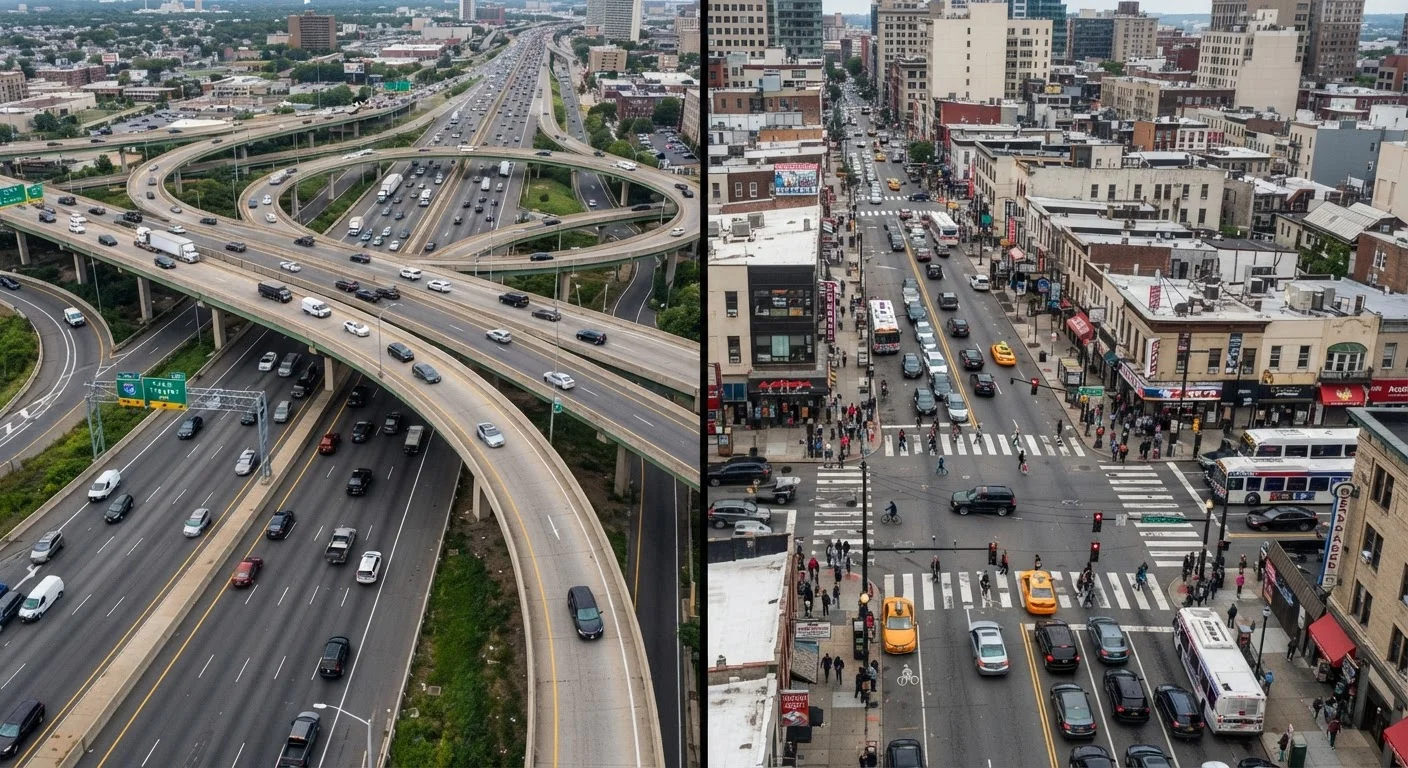
Key Takeaways
- Highway crashes are less frequent but far more likely to be fatal due to higher speeds.
- Surface streets account for the majority of all crashes because of dense intersection activity.
- Pedestrian and cyclist risk is concentrated almost entirely on surface streets, not highways.
- Driver fatigue and inattention are the dominant human factors on high-speed freeways.
- Intersection management - including signals and driver yielding - is the critical skill on local roads.
- Tailoring your mental engagement to the road type you're on is a core element of defensive driving.
Option A
Highway Driving
High-speed, controlled-access roads with fewer conflict points but severe crash consequences.
Best for: Covering long distances efficiently, with risks centered on speed, fatigue, and merging.
Option B
Surface Street Driving
Lower-speed urban and suburban roads dense with intersections, pedestrians, and unpredictability.
Best for: Short local trips, though the frequency of conflict points raises everyday crash probability.
If you want to reduce exposure to severe, life-threatening crashes
Surface Street Driving
Fatal crash rates per mile traveled are significantly higher on high-speed highways, largely because impact energy rises sharply with speed.
If you want to minimize your total number of minor collisions and fender-benders
Highway Driving
Fewer intersections, controlled access, and consistent traffic flow reduce the sheer number of conflict points compared to surface streets.
If you're a newer or less confident driver building skills
Surface Street Driving
Lower speeds allow more reaction time, though the complexity of intersections means structured practice with an experienced passenger is advisable.
Why Road Type Changes the Risk Equation
Not all driving risk is created equal. The hazards you face on a 70-mph interstate differ fundamentally from those on a four-lane boulevard through town - and confusing the two can lead drivers to adopt the wrong habits at the wrong moments. Understanding how each environment shapes crash likelihood and severity is a foundational element of defensive driving.
According to the National Highway Traffic Safety Administration (NHTSA), the majority of all reported crashes occur on non-highway roads, yet fatal crash rates per mile traveled are disproportionately high on high-speed limited-access freeways. That apparent paradox reflects a key principle: frequency of crashes and severity of crashes are driven by different factors. Surface streets generate more incidents; highways generate worse outcomes when incidents occur.
Speed is the primary lever. As stopping distance and crash physics illustrate, crash energy grows with the square of velocity - doubling your speed quadruples the energy that must be absorbed in a collision. That physics reality defines why highway crashes so often result in serious injury or death.
| Criterion | Highway Driving | Surface Street Driving |
|---|---|---|
| Typical speed range | 55-80 mph | 25-45 mph |
| Crash frequency | Lower per mile | Higher per mile |
| Fatal crash severity | Higher rate when crashes occur | Lower rate, but still significant |
| Primary conflict type | Rear-end, run-off-road, merging | Intersection, turning, pedestrian |
| Pedestrian/cyclist risk | Very low (controlled access) | High (constant presence) |
| Key driver risk factor | Fatigue, speed, inattention | Distraction, aggression, misjudgment |
| Intersection exposure | Minimal (grade-separated) | Constant |
The Highway Environment: Speed, Fatigue, and Merge Dynamics
Highways are engineered for throughput. Controlled access points, grade separations, and wide lanes remove many of the conflict types common on surface streets. But the environment creates its own hazard profile.
Speed compression is the most significant factor. At 70 mph, a vehicle travels roughly 103 feet per second. Reaction time - typically 1.5 seconds for an alert driver - consumes over 150 feet before braking even begins. Any lapse in attention, even momentarily, erodes the safety buffer dramatically.
Driver fatigue is also far more prevalent on highways than on local roads. Monotonous environments reduce cognitive stimulation, accelerating mental fatigue, a phenomenon sometimes called highway hypnosis. NHTSA data consistently identifies fatigue as a significant contributor to run-off-road and rear-end highway crashes.
Merge zones - on-ramps, lane drops, and interchange weaves - are where most highway conflicts concentrate. Clear signaling, consistent speed matching, and early lane positioning significantly reduce conflict during these maneuvers.
~56%
Fatal crashes occurring on non-interstate roads
NHTSA data consistently shows the majority of fatal crashes occur on non-freeway roads, where intersection and pedestrian exposure is highest.
103 ft/sec
Distance covered per second at 70 mph
At highway speeds, even a 1.5-second reaction delay consumes over 150 feet before braking begins - underscoring why following distance is critical.
~40%
Of all traffic fatalities linked to intersection-related crashes
The Federal Highway Administration estimates that a significant share of annual US traffic fatalities involve intersection or intersection-related incidents.
Surface Streets: Intersection Density and Vulnerable Road Users
Surface streets are defined by their complexity. Traffic signals, stop signs, turning movements, driveways, crosswalks, cyclists, and pedestrians create a high-frequency decision environment where attentional demands shift constantly.
Intersections are the dominant crash location on surface streets. Left turns across oncoming traffic are among the most dangerous maneuvers in everyday driving, accounting for a substantial share of injury crashes at signalized intersections. Driver misjudgment of oncoming vehicle speed is the leading cause.
Pedestrian and cyclist fatalities are overwhelmingly a surface street issue. These vulnerable road users rarely appear on limited-access freeways, but they are a constant presence on urban and suburban roads. Lower posted speeds on surface streets reduce - but do not eliminate - pedestrian fatality risk; crashes at 30 mph still carry significant injury potential.
Driver behavior patterns also differ. Aggressive driving behaviors such as running red lights, abrupt lane changes, and failure to yield are more common in stop-and-go urban environments where frustration builds incrementally. These behaviors compound the inherent complexity of the surface street environment.
Conditions that reduce visibility - darkness, rain, fog - amplify surface street risks further. Night driving and adverse weather demand specific adjustments on local roads where pedestrians and cyclists may be harder to detect.
School Zones and Residential Streets: A Special Case
Residential streets and school zones represent the highest-risk subset of surface street driving for pedestrians. Posted speed limits in these areas are set specifically to allow drivers time to react to unpredictable movements by children. Treating reduced-speed zones as genuine safety infrastructure - rather than inconveniences - is among the most impactful habit a local driver can maintain.
Adapting Your Driving Mindset to the Environment
The core behavioral takeaway is that each road type requires a distinct cognitive mode. On highways, the priority is sustained attention management: maintaining following distance, monitoring mirror checks at regular intervals, and combating the lulling effect of repetitive conditions. Taking breaks on long highway drives is not optional comfort - it is a safety practice.
On surface streets, the priority is situational scanning: continuously checking for pedestrians at crosswalks, cyclists in bike lanes, vehicles emerging from driveways, and signal changes. The lower speeds allow more reaction time, but only if the driver is actively scanning rather than reacting after the fact.
Your crash risk also has insurance implications. Where you drive, how far, and what road types you frequent are factors that inform how insurers assess your risk profile. For a deeper look at how driving environment and history interact with premiums, see how auto insurers calculate rates.
No road environment is categorically safe. Recognizing which hazards dominate each setting - and consciously adjusting your attention and behavior to match - is the practical foundation of lower-risk driving.